
The incentives report
Use this to see how much your organisation has spent on incentives by person, study or month. You can export the figures for your finance team.
It shows the incentives your researchers record in their studies. To record one, see Tracking incentives in a study.
Who can use this
Organisation admins.
1. Open the incentives report
- Click Admin dashboard in the sidebar.
- Click Incentives, under Overview.
2. Choose the dates
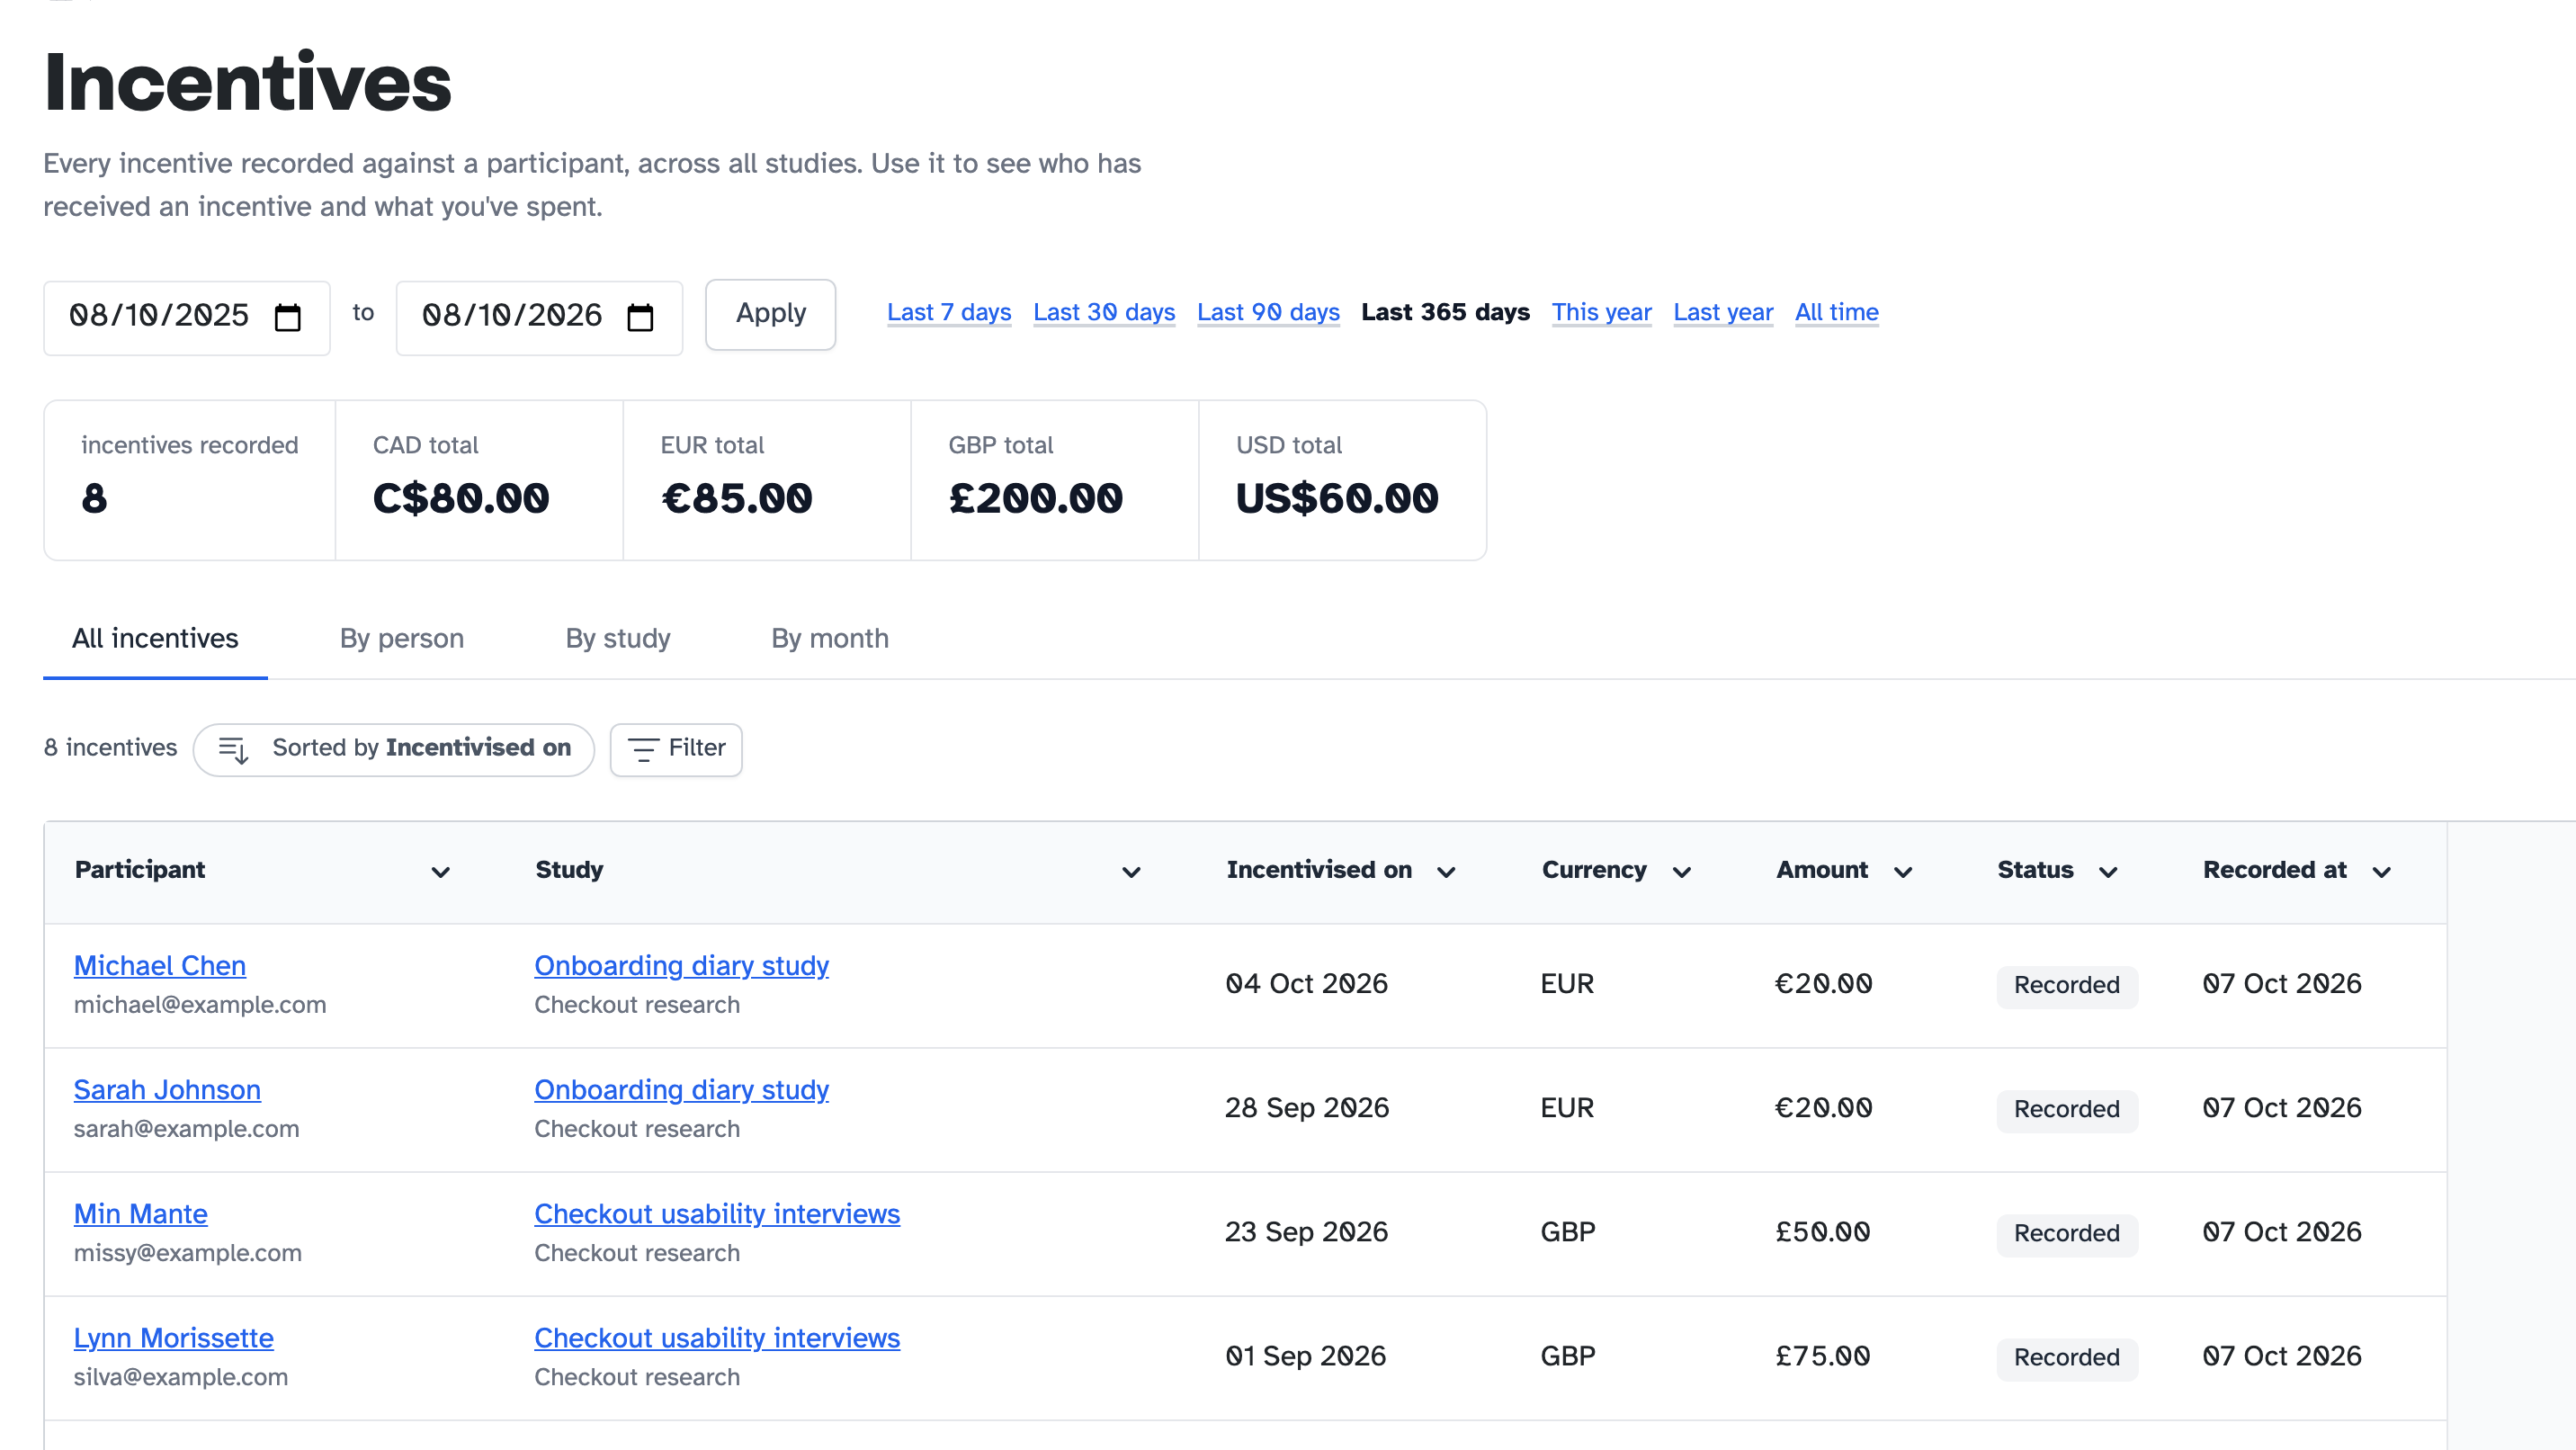
The report starts on Last 365 days. To change it, click Last 7 days, Last 30 days, Last 90 days, This year, Last year or All time.
For any other dates, like a quarter, choose them in the two date boxes and click Apply.
The report goes by Incentivised on, the date each person was given their incentive.
The figures at the top show how many incentives were given between those dates and the total for each currency. Currencies aren’t converted or added together.
3. Choose how to group them
Click a tab:
- All incentives lists each incentive, with the person, study, date, amount and status
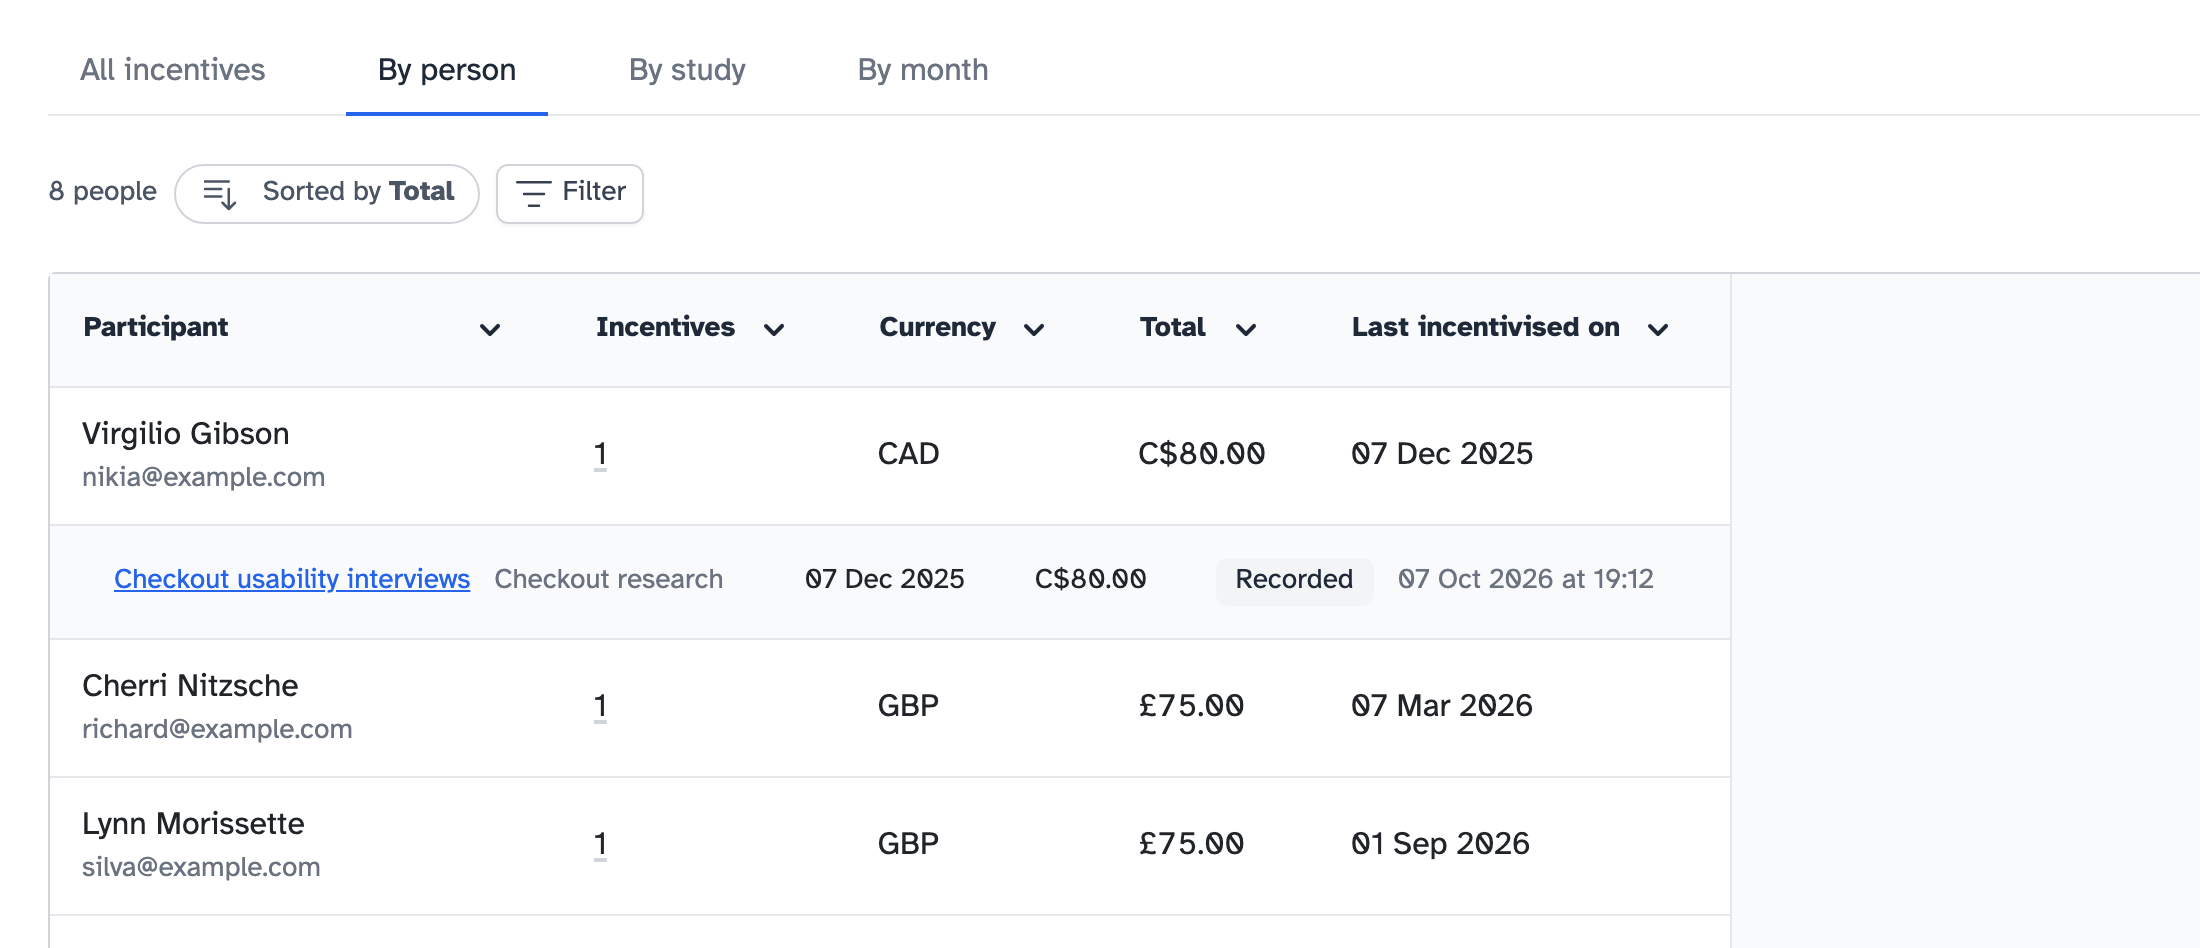
- By person gives a total for each person across every study
- By study gives a total for each study
- By month gives a total for each month
On By person, to see what makes up someone’s total, click the number in the Incentives column.
If a person, study or month has incentives in more than one currency, it has a row for each currency.
4. Filter by currency or status
- Click Filter, above the table.
- Choose Currency or Status.
- Tick what you want to see.
- Click Apply.
Incentives your team records show as Recorded, which means someone has paid them and logged it. The other statuses are for incentives sent through an incentive provider.
Filter only changes the table. The figures at the top still cover everything between your dates.
Switching tab clears your filters.
5. Export for your finance team
Click Export CSV, above the table, to download the table as a CSV file. It uses the dates and filters you’ve chosen.
- On All incentives, the file has a row for each incentive.
- On By person, By study and By month, it has a row for each total.
Key takeaways
💡 Remember: Each currency has its own total. They’re never converted or added together.
🧪 Try: Choose Last year, open By month and click Export CSV to send your finance team a monthly breakdown.
⚠️ Watch for: The figures at the top don’t change when you filter. For filtered totals, use By person, By study, By month or the export.
⚡ Quick tip: For a quarter, choose the dates in the two date boxes and click Apply.